JavaScript is a well-established coding language that was originally designed to enhance HTML. It's the backbone of many popular visualization libraries, used with Python such as Plotly, and is often used to create custom dashboards. JavaScript also provides a high level of customization: the dashboards built to deliver visual data, such as maps or graphs, can be as simple or complex as needed.
It is now clear the broad area of uses Javascript can be applied to. However that leads us to a more focused question, when concerning Data Analytics & Visualization.
How can I use Javascript to enhance the data analysis process?
In order to answer this question, I will be going over how ow to build a simple and customizable Web Application which will allow us to dynamically share data that is filterable based on user-end input using Javascript and HTML.
As aforementioned, Javascript and HTML go hand-in-hand, because there are many tools at our disposal when working with HTML, namely the javascript library D3.Js. D3 offers many methods that will allow our javascript to communicate with our html web page, in the form of selections which are essentially additional snippets of code that are inserted within our javascript script.
Resources
Including the D3, resources needed to create our web application are :
- a code editor (that supports JavaScript and HTML)
- D3.js
- HTML
- Javascript
- CSS &
- Bootstrap
The Components of this simple Web application frame-work are:
app.js
This will serve as the core of the application, in which our javascript code will be stored and run from.
D3 library
This will create a bridge between our webpage and javascript code. Allowing our application to [listen] for user input.
index.html
Our index file will define the structure of our web page when accessed via a web browser.
data.js
In order to have data readily available for testing and parsing, I have sample data(on UFO sightings) in JSON format for easy parsing.
CSS & Bootstrap
These will help with the design and responsiveness of the web page components.
Building The Application
While the main focus of this application and project is to share data, I will focus on the construction of the table that will display the data as well as the form that will allow user input.
Data
Our data is in JSON (JavaScript Object Notation) format, which is an array of “objects” containing key-value pairs. Each object of the array contains the same “keys” with different “values” which is our ufo sighting data. Because each object is the same “shape” and shares the same keys, it will be easy to transform and display the data into a tabular format.

HTML
Table
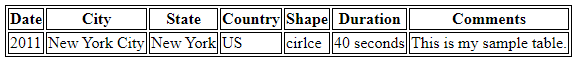
The html code acts as the skeleton and structure of the webpage. With html we can easily create a website template that is viewable within a browser.. The following html code will create a simple webpage with an appropriately coded table with columns that match the structure of my sample UFO data.
<!DOCTYPE html>
<head>
    <style>
        table, th, td {
          border: 1px solid black;
        }
        </style>
</head>
<body>
    <div >
        <table >
            <thead>
              <tr>
                <th>Date</th>
                <th>City</th>
                <th>State</th>
                <th>Country</th>
                <th>Shape</th>
                <th>Duration</th>
                <th>Comments</th>
              </tr>
            </thead>
            <tbody>
                <tr>
                    <td>2011</td>
                    <td>New York City</td>
                    <td>New York</td>
                    <td>US</td>
                    <td>circle</td>
                    <td>40 seconds</td>
                    <td>This is my sample table.</td>
                </tr>
            </tbody>
          </table>
    </div>
</body>
</html>Browser output:
Form
Since we want our data to be filterable based on user input, we will need an HTML component that allows this. Thankfully in HTML we are able to create custom forms! With the code below, we can add our form anywhere on the page that we please. For now I will place the form arbitrarily and focus on design when applying CSS.
<div id="form-div">
    <form >
        <ul >
            <h5>Filter Search</h5>
            <li >
                <label for="date">Enter a Date</label>
                <input type="text" placeholder="1/10/2010" id="datetime" />
            </li>
            <li>
                <label for="city">Enter a City</label>
                <input type="text" placeholder="san diego" id="city" />
            </li>
            <li>
                <label for="state">Enter a State</label>
                <input type="text" placeholder="ca" id="state" />
            </li>
            <li >
                <label for="country">Enter a Country</label>
                <input type="text" placeholder="us" id="country" />
            </li>
            <li>
                <label for="shape">Enter a Shape</label>
                <input type="text" placeholder="triangle" id="shape" />
            </li>
        </ul>
    </form>
</div>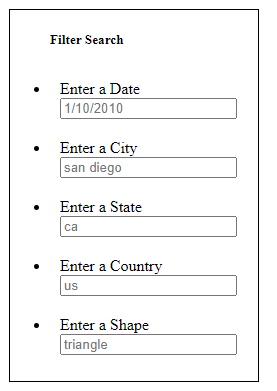
JavaScript, D3.js
In order for us to create a script of what we need, we first need to review what we need more granularly.
What we need our script to do:
1.display all of our data within the table
2.filter the data based on user input
In order for our code to work as expected and as smoothly as possible, we can further break down these segments with even more detail:
1.display data a. import and parse data
b. insert data into table to be displayed2.retrieve input and create filters a. check web page for user input
b. store user input as Javascript objects, to be used as filters3.filter data a. use filters as a criteria to remove table rows that do not match the criteria
b. insert filtered data into table to be displayed
The Script
With an understanding of what and how exactly we need our script to perform, we can then create your javascript code to our specifications with the addition of the D3 library selectors where needed.
// from data.js
const tableData = data;

// get table references
var tbody = d3.select("tbody");

function buildTable(data) {
  // First, clear out any existing data
  tbody.html("");
  // Next, loop through each object in the data
  // and append a row and cells for each value in the row
  data.forEach((dataRow) => {
    // Append a row to the table body
    let row = tbody.append("tr");
    // Loop through each field in the dataRow and add
    // each value as a table cell (td)
    Object.values(dataRow).forEach((val) => {
      let cell = row.append("td");
      cell.text(val);
    });
  });
}


// Create a variable to keep track of all the filters as an object.
var filters = {};

// Use this function to update the filters.
function updateFilters() {
    // Save the element that was changed as a variable.
    let elementInput = d3.select(this);
    // Save the value that was changed as a variable.
    let elementValue = elementInput.property("value");
    // Save the id of the filter that was changed as a variable.
    let elementId = elementInput.attr("id");
    // If a filter value was entered then add that filterId and value
    // to the filters list. Otherwise, clear that filter from the filters object.
    if (elementValue) {
      filters[elementId] = elementValue;
    }
    else {
      delete filters[elementId];
    }
    // Call function to apply all filters and rebuild the table
    filterTable();
  }


  // Use this function to filter the table when data is entered.
  function filterTable() {
    // Set the filtered data to the tableData.
    let filteredData = tableData;
    // Loop through all of the filters and keep any data that
    // matches the filter values
    for (var keys in filters) {
      filteredData = filteredData.filter(row => row[keys] === filters[keys])
    }
    //rebuild the table using the filtered data
    buildTable(filteredData);
  }


  // Attach an event to listen for changes to each filter
  d3.selectAll("input").on("change",updateFilters);

  // Build the table when the page loads
  buildTable(tableData);
With this script we are able to address all the needed steps for the application to work properly.
While at first glance the script can seem quite hefty, it is predominantly three digestible functions.
Additionally the D3 library allows the functionality needed for our scripts to execute properly. Without using D3 we would have to use very verbose methods, ultimately leading to less manageable code.
D3.js
“D3.js is a JavaScript library for manipulating documents based on data. D3 helps you bring data to life using HTML, SVG, and CSS.” , d3js.org
Thanks to the D3.js library, we are able to interact with the webpage(HTML code) through its selectors. These selectors are linchpins in our script and are referenced several times.
| Selector / Code Snippet | Purpose |
|---|---|
| var tbody = d3.select("tbody") | selects HTML table and assigns table reference as a javascript object |
| d3.selectAll("input").on("change",updateFilters) | detects input when there is a "change" within the webpage form area |
| d3.select(this) | selects and initiates array of inputs from webpage webpage |
Building the table
After importing the data (app knows the directory to look into) and assigning it to a variable within our global scope, the buildTable function parses the data
and transforms the data which is in json format. Each nested object (data value) within the data array is wrapped in the appropriate html tags (“tr”,’td”) to enable the appropriate rendering within the web page table.
update Filters
After our buildtable function we declare an empty array filters which will be used to store our filter values.
The following function uses a d3 selector to select and initiate an array of user input values as a key,value pair based on the “id” of the input area”.
The “key” being the “id” of the input tag, and the “value” being what is entered within the input area (pictured below). The array of these pairs are then saved within our filter variable.
 </figure>
Filtering the Table
Our third function filters the table by matching the values of our filters array with the rows of our imported data. The filtered data is then parsed by the buildtable function, effectively displaying a new (and filtered) table within the webpage.
This process is achievable with a simple for loop because our table is structured to match the keys of our data.

Structure and Functionality
With our Javascript code ready and html template set up, we are close to being able to test out our web application. However we first need to make sure our files are ready to communicate with others.
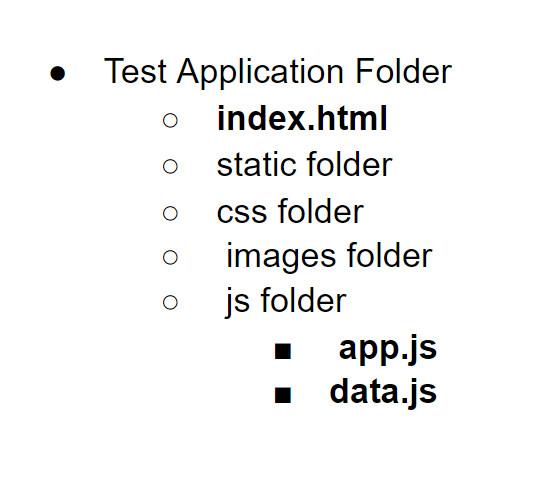
First we need to make sure our files are appropriately nested and filed within the correct directories. to maintain organization it is important to maintain a comprehensible framework and structure. In the scenario in which I want to make updates in the future, it will be quite easy for me to scale my application with little confusion.
Web Application frame-work:
We also need to add our file locations to our html webpage. The file locations should reflect the framework of the application and its relative locations to index.html. Additionally we need to add the D3.js CDN((Content Delivery Network) link to your webpage
Add the following html code within the body at the end of your webpage:
    <script src="https://cdnjs.cloudflare.com/ajax/libs/d3/4.11.0/d3.js"></script>
    <script src="static/js/data.js"></script>
<script src="static/js/app.js"></script>D3.js CDN Link reference
More on CDNs
Finally we can test our Application and its functionality. Upon opening the index.html file in our web browser, we can see that all of our data has been inserted into the once blank table.


Great! The application is functioning beautifully and filtering the data seamlessly.
While functionality is of the utmost importance, so is visualization. Without eye pleasing design, many if not all users will not be drawn in enough to review the application let alone take the time to explore and filter the data itself.
Style
With our form and table ready to go, all that’s left is to add styling and design to the webpage. To build-out my webpage I will be using Bootstraps grid system and css designs along with my personal preferences for additional “character”. Bootstrap’s grid system makes it easier to apply fluidity, structure and responsiveness to your web page. Additionally, using Bootstraps css properties allows for a streamlined experience when designing.
[design table]
Final Product
After applying the style and design changes, the web application is ready for deployment to be shared with the world!
Further Development
With all great projects and applications, there is always room for improvement and further development. This is especially the case in tech, in which new tools and features are consistently made available.
Amongst several ideas I have for improving this project, I’m most excited about building-out a method to retrieve live data and to have automated visualizations based on the data. The application itself was meant to be quite versatile and reusable. Thanks to this the code can be easily refactored to fit many data sources and forms. Please feel free to review the projects repository on GitHub and use the code as you like for your own practice/work.
Thank you for reading!